
Promotions built on your base price
Promotion optimization for grocery. Every offer planned against the everyday price behind it, forecast before the ad drops, and measured against baseline after it closes.
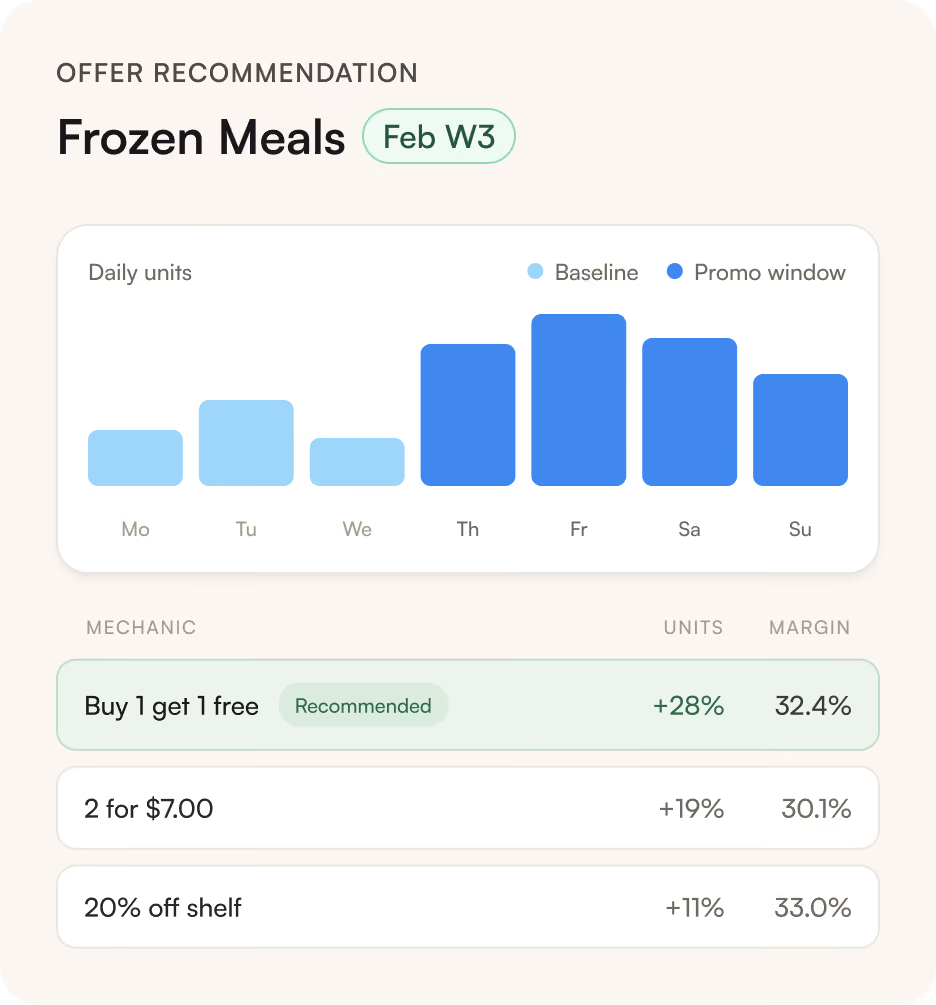

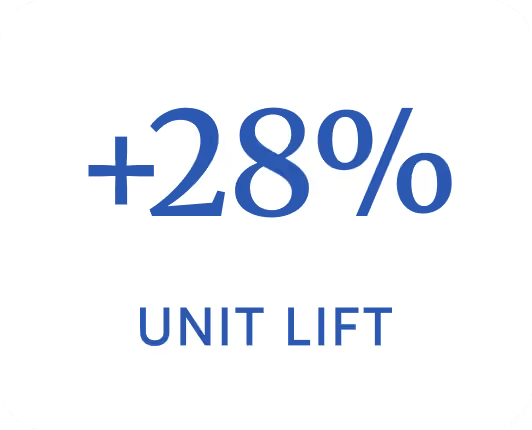



















How many of your promotions actually made money?
More money moves through promotions than through any other lever on the shelf. IDC has observed promotions management alone driving 5 to 6% profitability improvement, and most retailers cannot say which events delivered it.

You plan the next promotion before you know what the last one did
Promotions are one of the biggest controllable levers in grocery, and FMI found 74% of shoppers credit retailers for offering them. Few teams can say which ones worked.
Plan promotions against the base price behind them
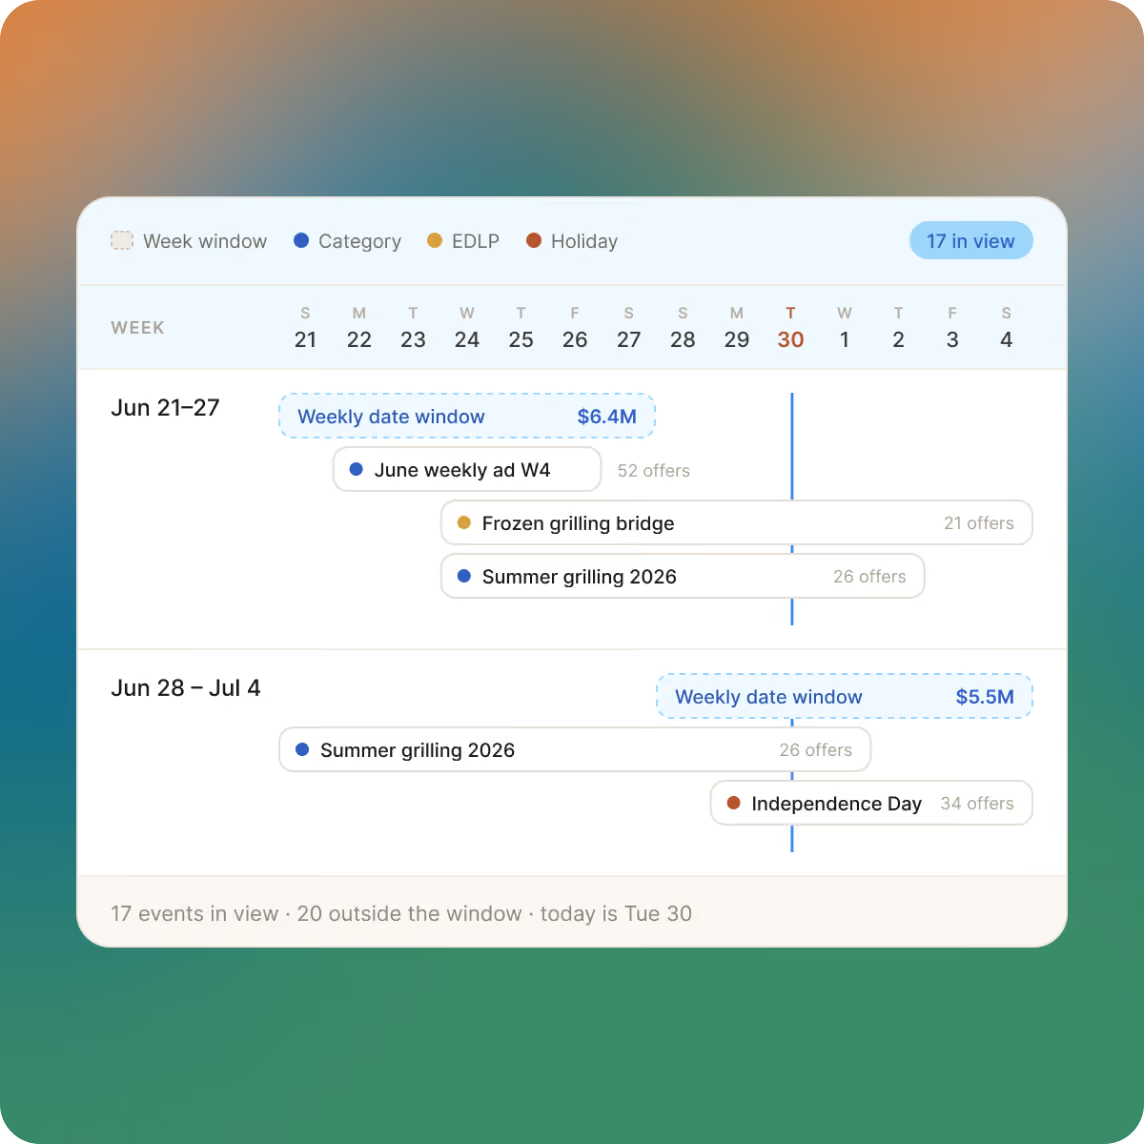
Your promotion calendar, your everyday prices, and category performance in one planning view, so every offer is built against the price it discounts from.
One planning view for the full calendar, so category, pricing, and the ad team are working from the same plan.
Every offer planned against the everyday price behind it, so a promoted price never lands above the price it discounts from.
Offer mechanic, promotional timing, and the business objective set in one place rather than across three tools.
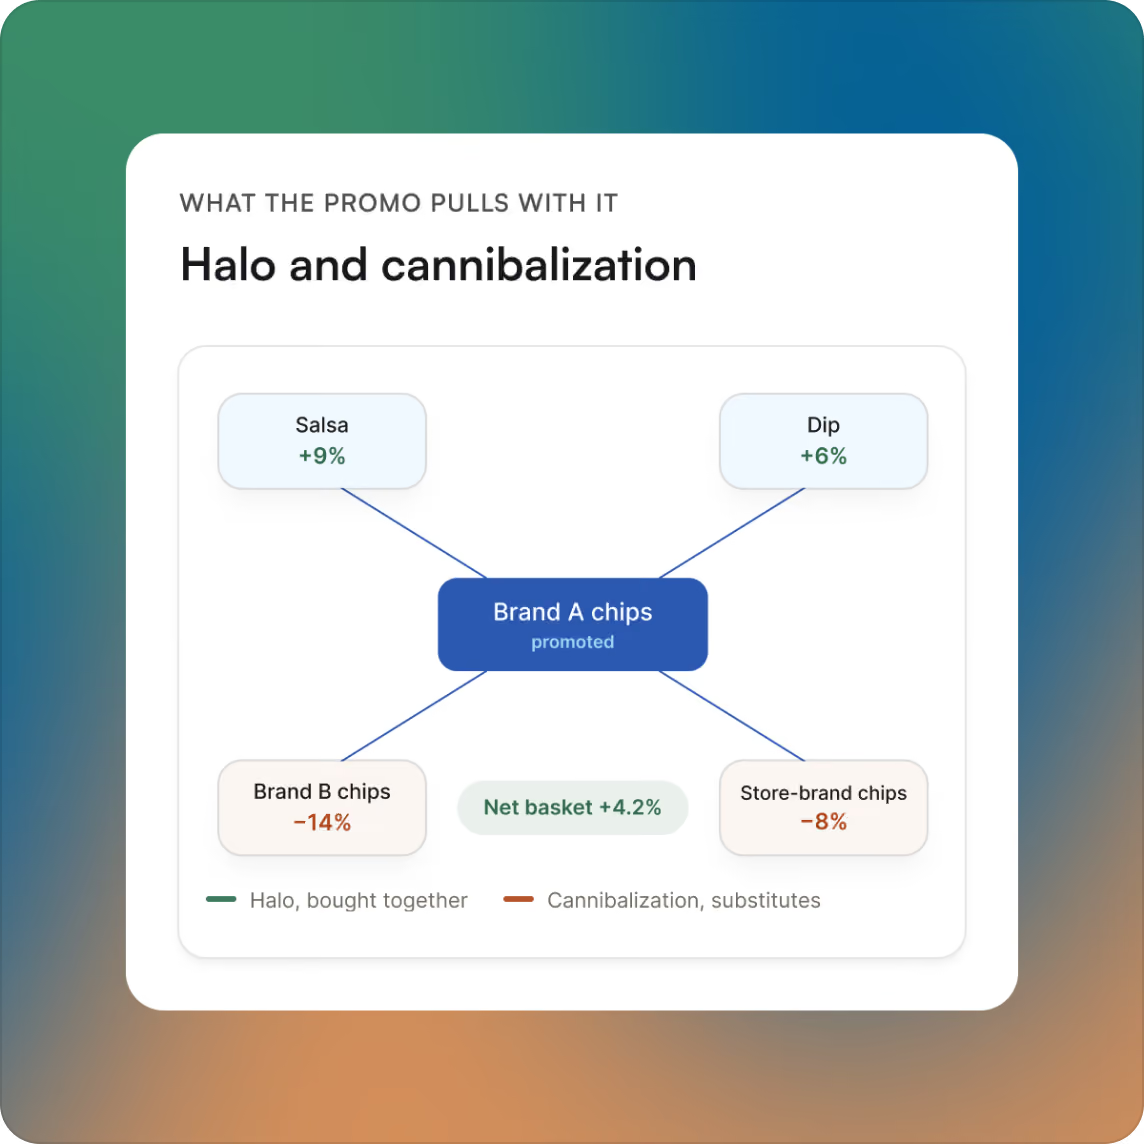
Forecast the offer before you commit to it
Model the mechanic, the depth, and the timing, and compare the options against each other before the ad is committed.
Forecast BOGO, percentage off, and loyalty offers, so your team picks the structure most likely to drive incremental value.
Run multiple options against each other and see which one performs best before anything goes live.
Projected volume for the event at planning time, so mechanic and depth are chosen on expected response rather than on what ran last year.
Close the loop so every event makes the next one smarter
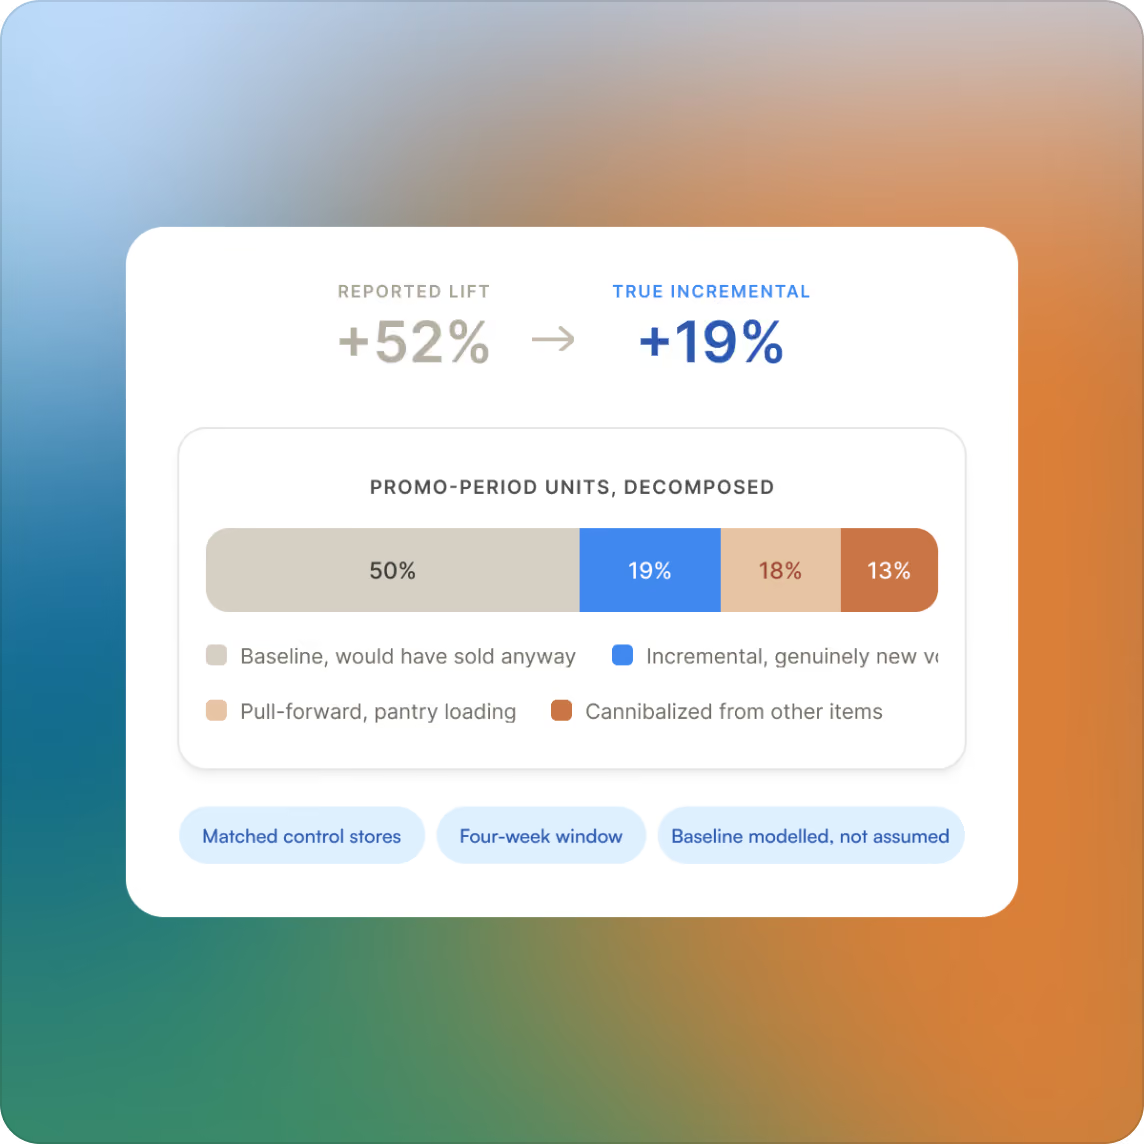
Circana notes that topline sales rarely reveal whether a promotion created new demand or subsidized purchases that would have happened anyway. That gap is what we measure.
Every event compared to what you would have sold without it, so you know which promotions created demand and which paid for demand you already had.
Projected versus actual, so you see where the model was right and where it needs work.
The events that lose money get identified and cut, and the funding moves to the ones that work.
How One Grocery Retailer Used Price Optimization to Boost Profit +2.78%
A well-known regional grocer measured every price change against a backcast of doing nothing, then reinvested where the basket had room. Frozen led at 4.81%.
profit across key departments
total revenue growth
profit lift in frozen
NRF Top 20 Grocer, Promotion Optimization
An NRF Top 20 grocer put its promotion history through the model and found roughly a third of its events were unprofitable. It retired them and rebuilt the ad around the ones that earned.
promotions were not making money
US grocery retailer
From Manual Pricing to $6M+ in Profit: How One Convenience Retailer Transformed Their Margins
gross profit within 2.5 years
uplift in gross margin across 10+ key categories
saved weekly through automation
Four modules, one demand model
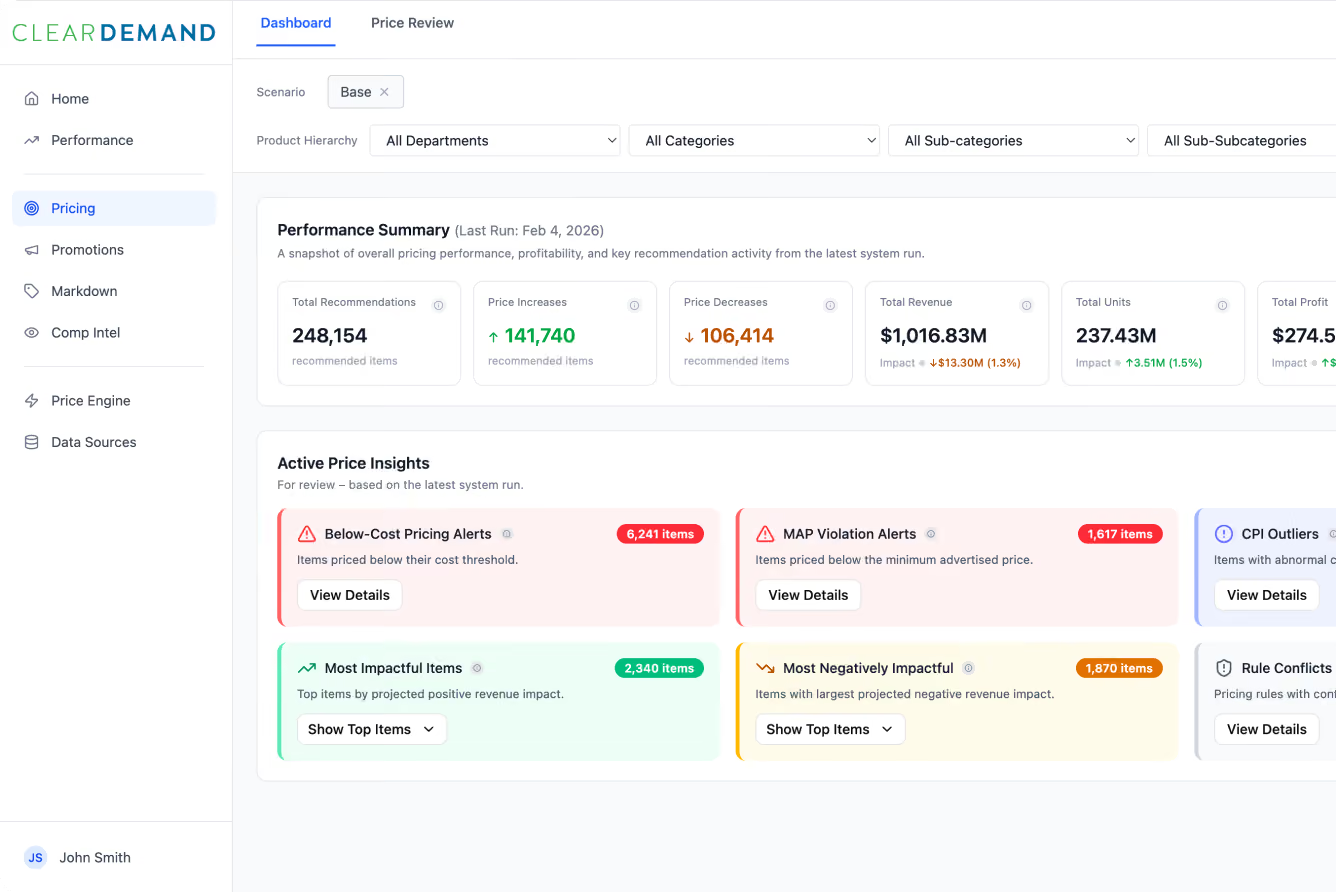
Hold price image, find the margin
Everyday price solved item by item and zone by zone, with your rules applied and the KVIs shoppers watch held sharp.
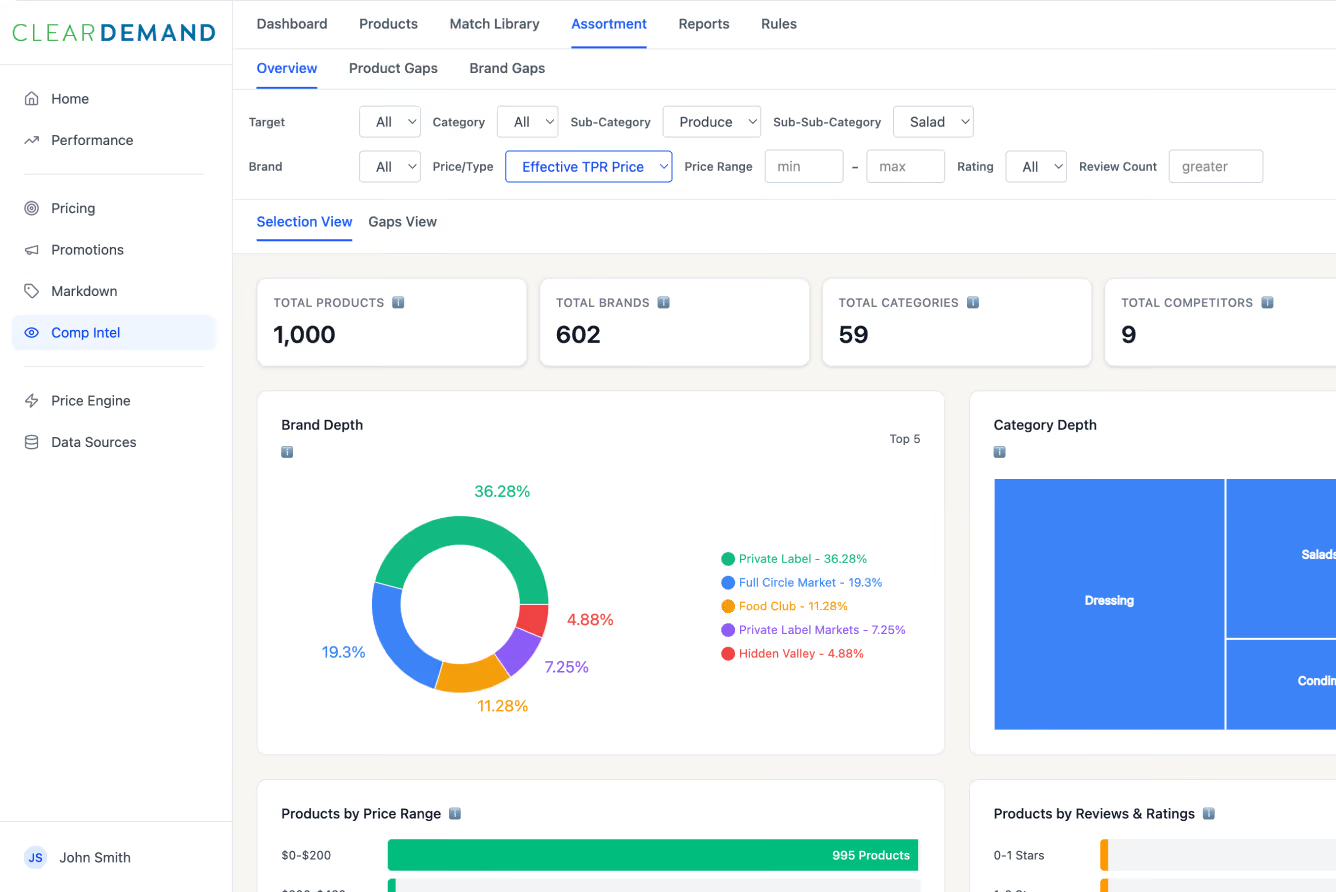
The market, matched to your catalog
7M+ competitive prices a day across a 240+ retailer network, matched to your items and fed straight into the price recommendation.
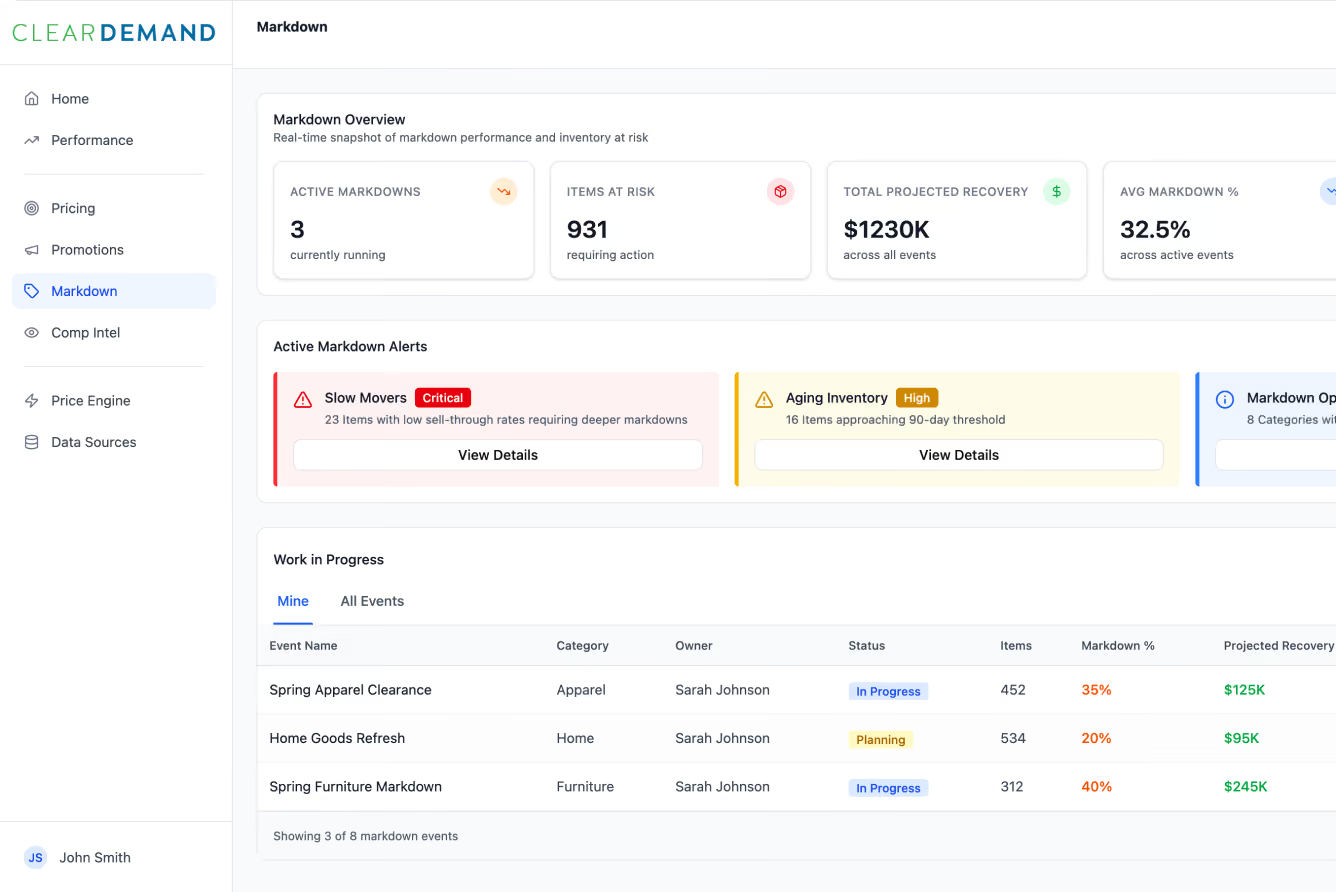
Clear inventory without giving away margin
Markdown timing and depth priced on demand response and inventory position rather than a blanket percentage off.
Frequently asked questions
Bring us your last flyer
We will show you which events beat their baseline and which ones just moved volume forward.
